A chi-square distribution with k density function (k d.f.) describes what happen when you take k standard normal r.v’s, square them, and add them together. Density function is the number of values in the final calculation of statistic that are free to vary.
Degree of freedom is the number of values in a study that are free to vary. For example, if you have to take ten different courses to graduate, and only ten different courses are offered, then you have nine degrees of freedom.
Nine semesters you will be able to choose which class to take; the tenth semester, there will only be one class left to take – there is no choice, if you want to graduate.
The chi-square distribution that is right skewed, as the degree of freedom increase, the distribution becomes more symmetric and flattens out.
Then, if we assume that x in the variance formula is iid normal, then the sample variance looks like chi-square because remember the formula of chi-square is the sum of Z with the iid normal (0,1). Then we can use this to make confidence intervals for variance notation.
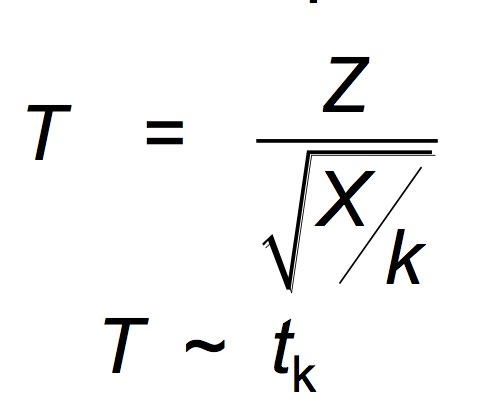
t-distribution with k density function describes a standard normal divided by the square root of a “normalized” chi square (a chi-square with k density function divided by k (standard normal r.v’s)
The t-distribution has “fatter tails” (or higher kurtosis) than normal (imagine bell shaped curve). At about 30 degrees of freedom and higher, though, the t and the normal are pretty much the same. why t-distribution is useful?
Confidence intervals have been based on the approximation of: 1) use of central limit theorem and 2) use of estimate in standard error formula. It is for small n these approximations might not be so good, this is good for large sample and iid Normal. The formula is the average minus mean (normal) divided by Chi-square.
If we assume the data iid normal we can obtain exact 95% Confidence Interval. The “2” (which is really 1.96) gets replaced with a “tval”
The “Plug in” Predictive Interval for the IID Normal Model. The amount of cereal in the next box will be an independent draw from the same normal distribution the observed data came from.
There is a 95% chance the next observation will be in the interval with means plus 2 times standard deviation to the left, supported with bell shaped curve. The plug in interval ignores the fact that there may be error in our estimates. But it is still a sensible way to think about what the estimates are saying. If the confidence interval for mean is big, the plug in interval may be a bad idea.
Hypothesis Tests and p-values for IID Bernoulli data.
Go back to cereal box example. Suppose the company manager claims that on average, 350 grams of cereal are put into each box. What does this mean? If weights are IID normal with mean = 350, then in the long run, we will see an average of 350 grams per box. We want to test the claim or hypothesis that mean is 350.
Suppose we look at 4 cereal boxes and the average weight in each is 345 grams. What does that tell us about mean is 350. Suppose we make 1000 parts and 220 parts are defective (the estimated defect rate is 0.22). What does that tell us about p=0.1?
If we get 1 out of 4, then we have 25% defective, but that could happen if p=0.1! Based on this data, it seems hard to reject the claim. 220 out of 1000 would be highly unlikely if p=0.1. Based on this data, we are likely to reject the claim. Basic intuition (and strategy): if something happens which would be really unlikely if the hypothesis were true, then we reject the hypothesis.
A p-value asks: if we assume the null hypothesis is true, what is the probability of getting a sample with this much, or more, evidence against the null hypothesis. A small p-value means that it is very unlikely that a sample with this much evidence against the null would have popped up by pure chance.
The term p-value has nothing to do with the parameter p in the Bernoulli distribution. They are two different concepts.
Rejection and the p-value.
If the test stat is less than 2 (in absolute value) then p-value is greater than 0.05. If the test stat is greater than 2 (in absolute value) then p-value is less than 0.05. If you want to accept or reject you can just look at the p-value. But the p value tells you much more!!
The test the null hypothesis at level 0.05, we reject if the p-value is less than 0.05.
Small p-values => big z value => reject. To test the null hypothesis at level alpha, we reject if the p-value is less than alpha.
Confidence Intervals, Tests and p-values in General
We have discussed confidence intervals for two parameters: the mean of iid normal observation and p, the probability of 1, for i.i.d. Bernoulli observations.
More generally, we could have a parameter which could call theta. Theta represents a true feature of the process or population under study. Given a sample we obtain an estimate of theta, say theta.
Confidence Interval. Because of the variation inherent in our data, we know our estimates could be wrong. The standard error tell us how wrong can it be. In general, the estimator is approximately normally distributed, there is a 95% chance that the true value will be within 2 standard errors of the estimate.
The formula is almost similar as mean plus standard deviation but here is the theta plus standard error. Hypothesis test is answered by p-value. In particular, if the p-value less than alpha, then we reject at level alpha. We don’t have to understand the details of the test, we do have to understand the modeling assumptions that underlie it. BDS test for independence, as described in Brock, Dechert, Shcheinkman and LeBaron (1996).
In general, given the model we compute a confidence interval as estimate +/- standard errors. In general we can assess a hypothesis by the p-value. Small p-value +> reject.
The standard errors and p-values are computed given the basic assumptions of the model. To use them properly, we must understand what these are.